Your cart is currently empty!


Andrew's Toolbox
Custom Coding for Investing


Instructions and Code For Converting Intraday Data from ThinkOrSwim To Excel Without Using An API
$30.00
Available for download are instructions and code for extracting intraday data from ThinkOrSwim and converting it into Excel using the Power Query function for analysis and charting. With these instructions, you will be guided through a step-by-step process for obtaining the open, high, low, close, and volume for each candle out of ThinkOrSwim and into…
Description
Available for download are instructions and code for extracting intraday data from ThinkOrSwim and converting it into Excel using the Power Query function for analysis and charting. With these instructions, you will be guided through a step-by-step process for obtaining the open, high, low, close, and volume for each candle out of ThinkOrSwim and into an Excel table. The video walks through the process of obtaining the data from ThinkOrSwim, pasting the appropriate code into excel, and steps for creating a chart for visual purposes. If you have struggled to obtain intraday data or create visually appealing stock charts, this product is the perfect solution.
Intraday means a price chart where the candles represent a time period of less than one day. This includes 1 minute candles, 5 minute candles, 1 hour candles, etc. There is a separate but similar item available for purchase that was written for charts where candles are daily or above.
Before purchasing, please note a couple of things:
- The code utilizes Microsoft Excel’s Power Query function. In previous years, this was a free addon that could be downloaded on Microsoft computers. Recent reports suggest it is now available for download on Mac computers. The code was written and tested on Microsoft computers and I cannot guarantee that it will work on any other operating system.
- This project was written and full steps and code are posted online for free. This purchase provides a way for viewers to support my work and more easily access the needed code. Setup or adjustments to the code are not included. Any special requests to alter the code will be subject to an additional fee for time spent in the three figures.
You can view a complete video walkthrough of all the steps at the video below:
The follow up video which goes over how to speed up the download process can be viewed here:
Only logged in customers who have purchased this product may leave a review.
Related products

Code For Downloading End of Day Option Data From CBOE Datashop
$20.00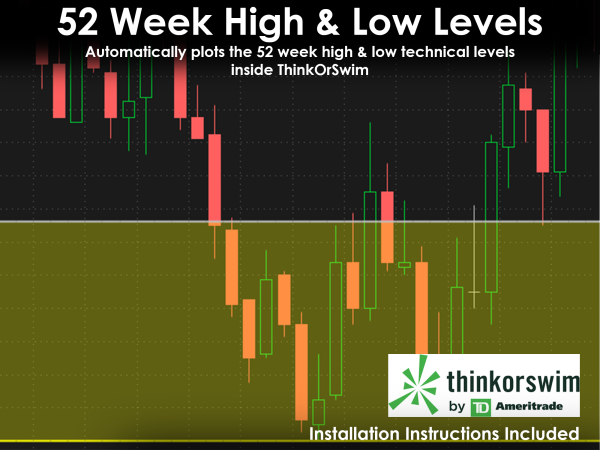
52-Week High & Low Technical Levels
$50.00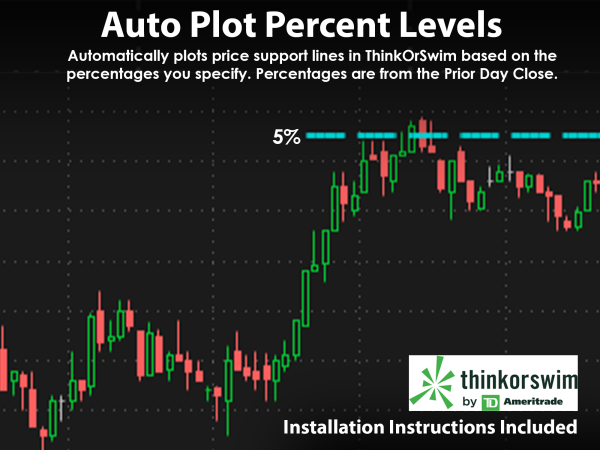
Percent Change Technical Indicator
$50.00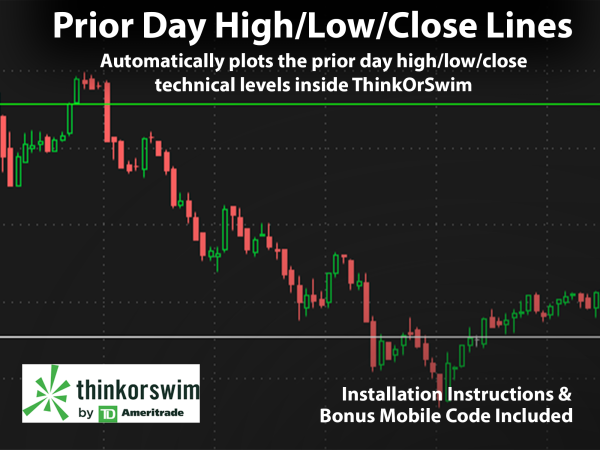
Prior Day High, Low, & Close Technical Levels
$50.00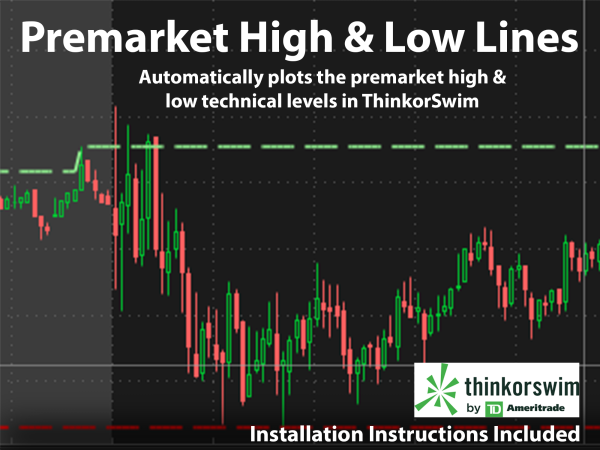
Premarket High & Low Technical Levels
$50.00
Reviews
There are no reviews yet.