Your cart is currently empty!


Andrew's Toolbox
Custom Coding for Investing
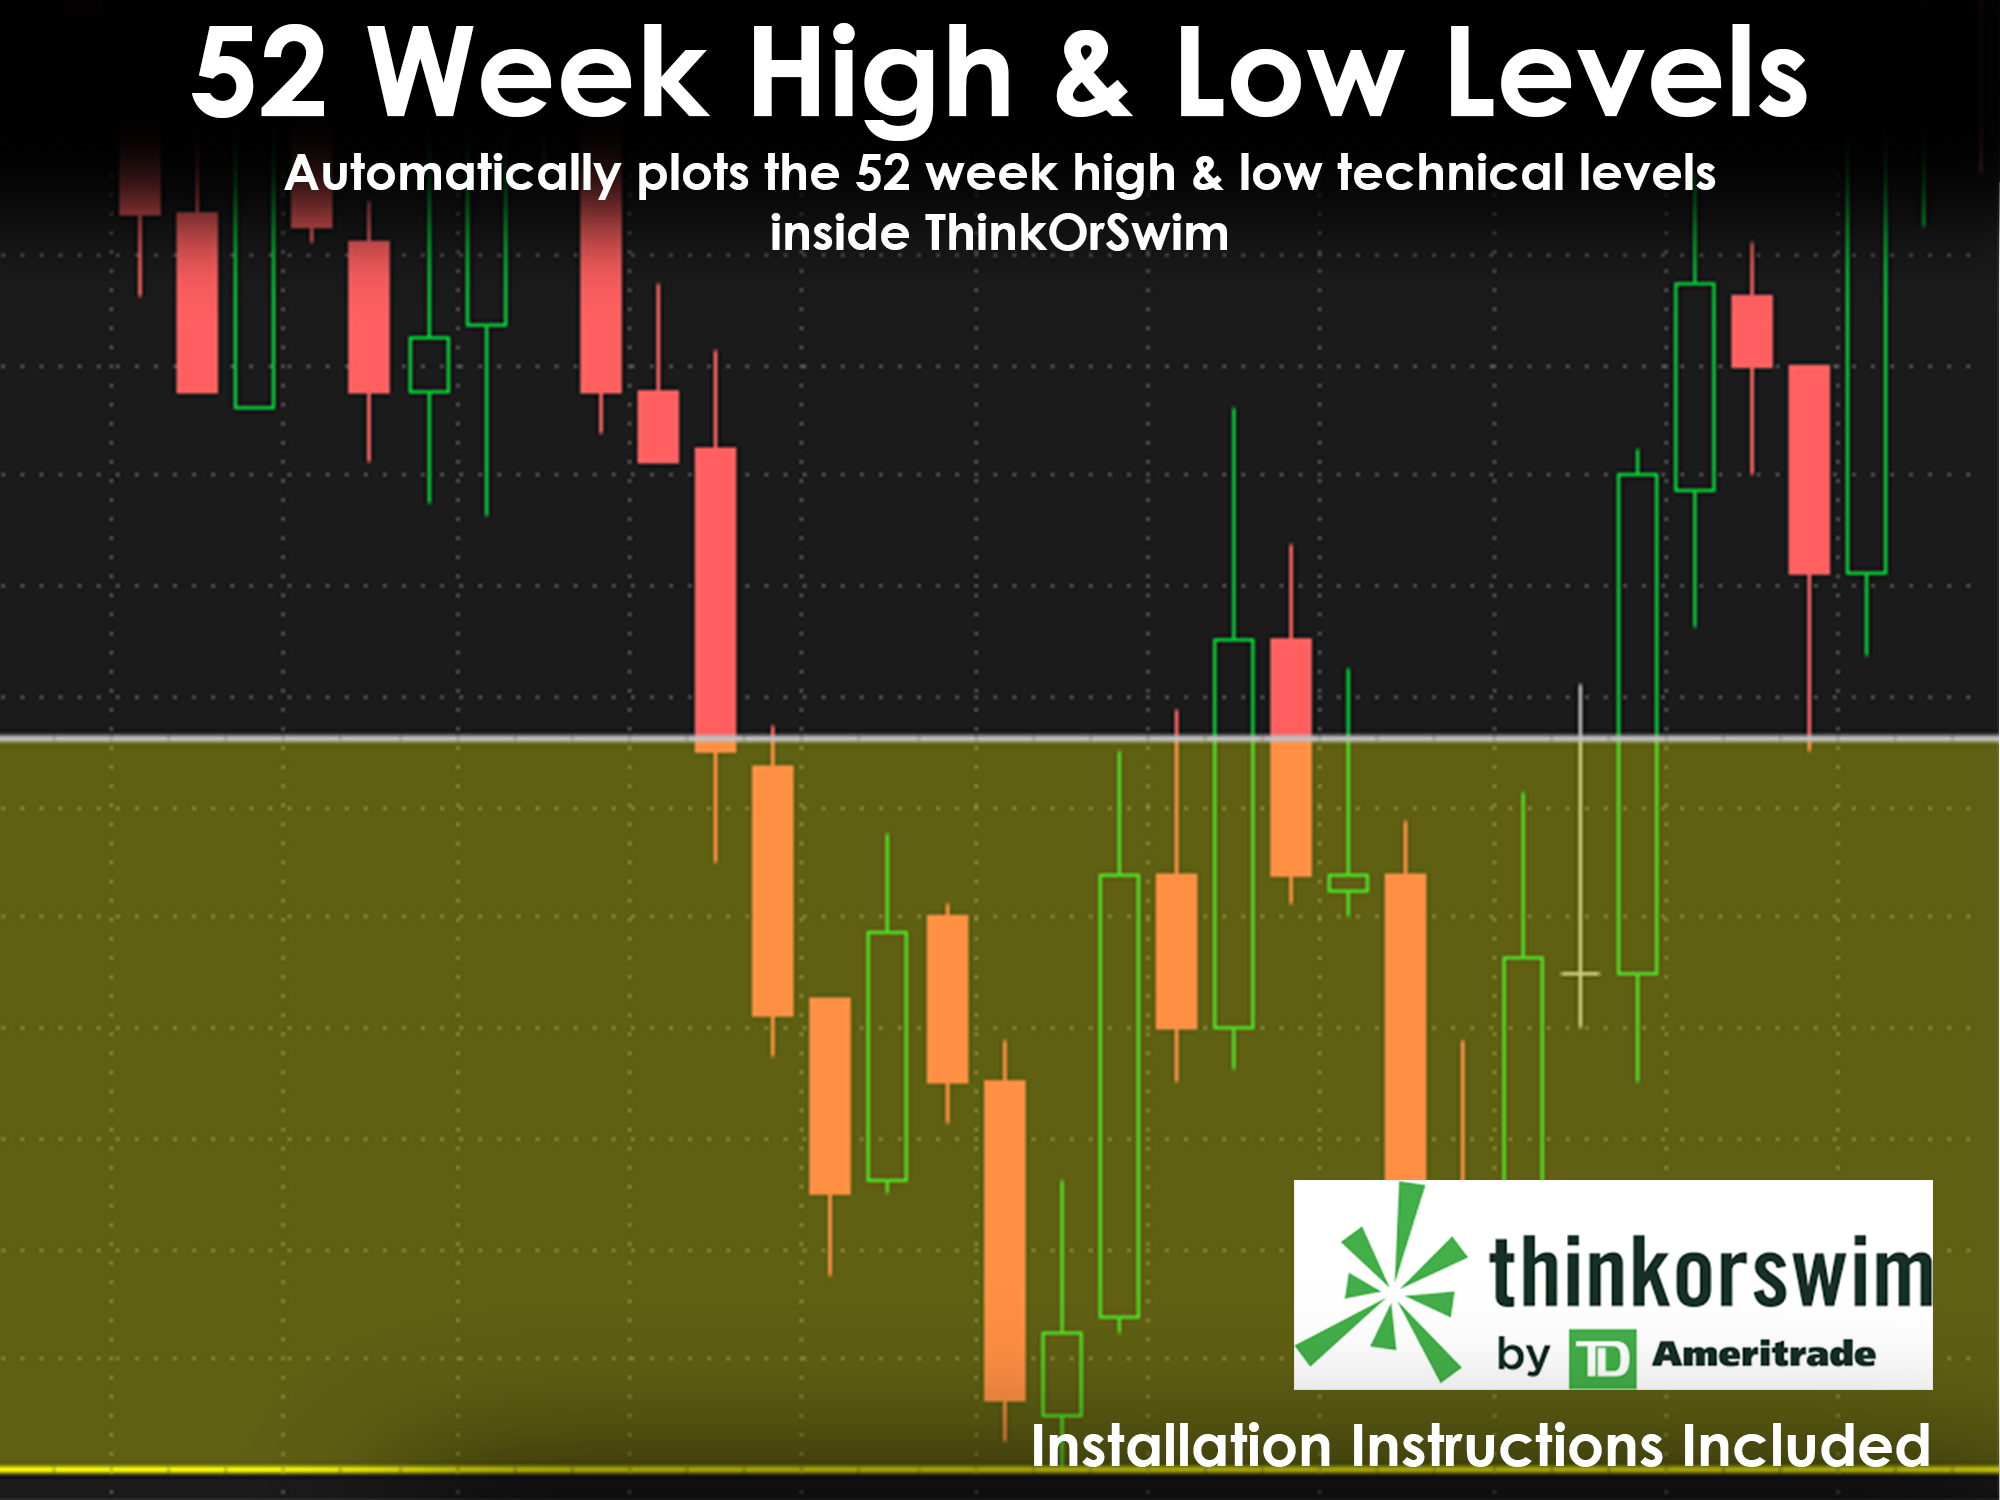
52-Week High & Low Technical Levels
$50.00
This is a custom script for TD Ameritrade’s ThinkOrSwim that automatically plots the 52-week high and 52-week low on a chart. The code works on all tickers. This code was designed to strike a balance between simplicity and user customization. It has the following features: • Will automatically adjust to the aggregation period of the…
Description
This is a custom script for TD Ameritrade’s ThinkOrSwim that automatically plots the 52-week high and 52-week low on a chart. The code works on all tickers. This code was designed to strike a balance between simplicity and user customization. It has the following features:
• Will automatically adjust to the aggregation period of the chart you are using. For example, if you change from a week chart (52) to a day chart (252), the code will automatically adjust the number.
• Ability to hide the line when the stock price is a certain percent away from the level. You can adjust the percent level as needed. (this controls the zoom of the graph).
• Ability to toggle the line on and off on all days before the current period.
When you purchase the code, you’ll receive a Microsoft Word document with the code and detailed instructions on how to install the code and customize it to your needs. Additionally, the video(s) linked below provides a guide on what each input does and how it will affect your graphs. By purchasing the code, you agree not to share or resell the code or any materials provided.
Please note that this code does not currently work on the mobile app. This is due to ThinkOrSwim not making their app compatible with certain codes. This could change in the future. Please follow my Youtube channel for updates.
Please watch my walkthrough video below to get an idea of how the code works:
Only logged in customers who have purchased this product may leave a review.
Related products
Instructions And Code For Converting Daily Data From ThinkOrSwim to Excel Without Using An API
$30.00
Custom Scripting
$100.00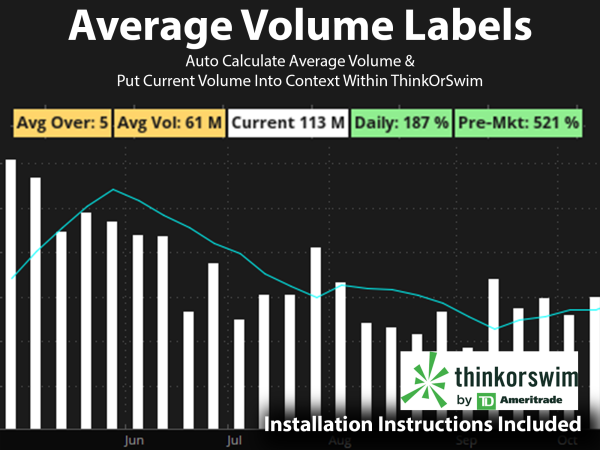
Average Volume Labels
$50.00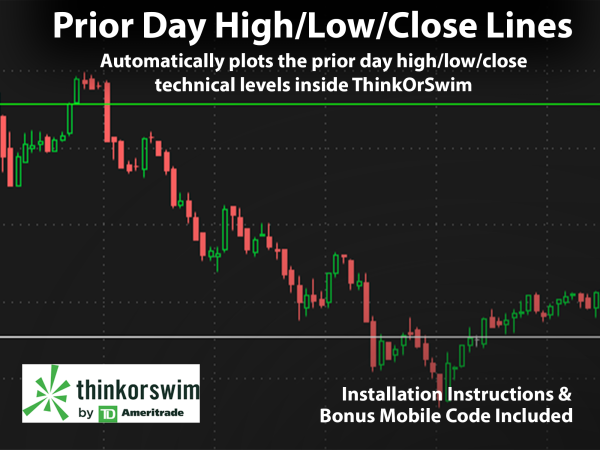
Prior Day High, Low, & Close Technical Levels
$50.00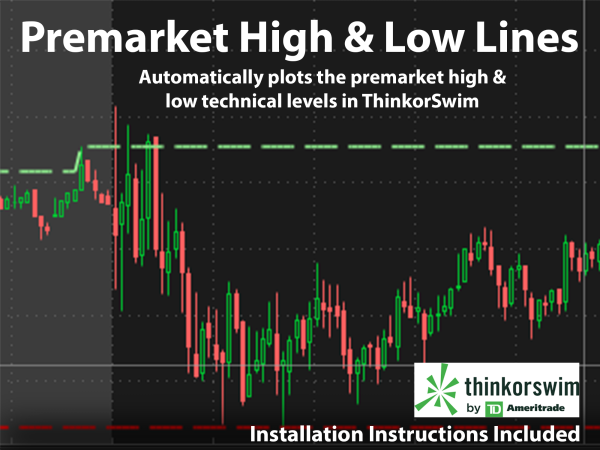
Premarket High & Low Technical Levels
$50.00
Reviews
There are no reviews yet.